CSS Performance: How Stylesheets Affect Core Web Vitals and Rendering Cost
CSS performance affects Core Web Vitals through layout, paint, and composite costs. Learn which declarations trigger each stage and how to measure their impact on LCP, CLS, and INP.
The Real Cost of CSS is Not What You Think
Most performance advice treats CSS as a parsing problem. It is not. The parser is fast. Stylesheet weight is rarely the bottleneck. What costs you your Core Web Vitals is the work your CSS forces after parsing: layout, paint, and composite. Every selector, every declaration, every animation you ship either reduces that work or multiplies it. This guide maps that territory. The territory is measured in Largest Contentful Paint (LCP), Cumulative Layout Shift (CLS), and Interaction to Next Paint (INP), the three metrics that define whether a page feels fast. This is the CSS performance Core Web Vitals hub. Its job is to name the mechanism, not the symptom.
Layout Paint Composite Cost CSS: Where the Work Actually Happens
When you change a CSS declaration, the engine does not redraw the page automatically. It runs a specific part of the rendering pipeline. Which part runs depends entirely on the declaration you changed. The cost is not uniform. Some declarations trigger only a style recalculation. Others force layout, the most expensive step, because it recalculates the geometry of every affected element. A few declarations trigger paint. Paint is faster but still costly when it covers a large area. Only a small set triggers composite, the cheapest step, because it runs on the compositor thread and never touches the main thread.
The Declaration That Solves More Problems Than Any Other
Here is the rule that fixes more performance problems than any other. It stops the engine from doing any of that work on elements that are not on screen:
.long-feed {
  content-visibility: auto;
  /* Skips layout and paint for off-screen children;
     they are rendered lazily as the user scrolls. */
}
content-visibility: auto applies CSS containment in all dimensions. The engine skips the layout and paint step for the entire subtree until it is near the viewport. On a long page, this cuts initial layout and paint work by 50-90% (Chrome team data, 2021). It is the single highest-impact declaration for reducing LCP on content-heavy pages.
The Declaration That Most Often Fails
The opposite problem, the rule that most often causes a performance failure, is a large, blurred box-shadow on a big element. It is a paint-only declaration, but paint cost is proportional to the painted area. A 500px by 500px shadow with blur is not cheap. It forces the compositor to repaint that entire region on every animation frame that touches it. The fix is not to avoid shadows. Use them where the painted area stays small. Or animate transform and opacity, which do not repaint, instead of the shadow property itself.
CSS Rendering Pipeline Performance: the Order of Operations
The rendering pipeline is the sequence of steps the engine runs to turn a DOM tree into pixels: style recalculation, layout, paint, and composite. The critical thing to understand: the pipeline does not always run fully. Change a declaration that affects only style, and the engine skips layout and paint. Change one that affects geometry, and it runs layout, then paint. Knowing which declarations map to which step is the entire game of CSS performance.
How Three Common Declarations Trigger Different Steps
Changing color on a p triggers only style recalculation and paint. Changing width triggers layout. Changing transform triggers composite only, but only if the element has its own compositor layer. This is why will-change exists. It hints to the engine that an element is likely to change, so it can promote it to its own layer ahead of time.
.animated-card {
  will-change: transform;
  /* Promotes the element to its own compositor layer.
     Use sparingly: each layer costs memory. */
}
Overusing will-change is a known failure mode. Every element you set it on creates a compositor layer. A page with too many layers is slower than one with none. Apply it only to elements you are about to animate. Remove it when the animation ends. The compositor thread is not a free lunch. It is a different lunch with different portions.
Critical CSS LCP Optimization: What Delays the Largest Paint
Largest Contentful Paint is the moment the engine paints the largest image or text block above the fold. Two CSS things delay it: render-blocking stylesheets and layout work on that above-the-fold content. A stylesheet is render-blocking because the engine will not paint until it has downloaded and parsed the full stylesheet. The standard fix: inline critical CSS in a <style> tag in the <head> and load the rest asynchronously. The threshold for that inlined critical CSS is small. 14 KB compressed, which fits in the TCP slow-start window and requires only one round-trip. Any more, and you are adding a round-trip to the critical path.
Layout Work Delays the Largest Paint
Once the CSS is loaded, the layout work matters more. If the largest element is an image, the engine has to know its dimensions before it can reserve space. If you have not set width and height attributes, or aspect-ratio in CSS, the engine waits for the image to load to determine its size. That delays the paint. The fix is in the CSS, not the image format:
.hero img {
  width: 100%;
  aspect-ratio: 16 / 9;
  /* Reserves space before the image loads,
     so layout does not shift and LCP is not delayed. */
}
Unused CSS INP CLS Impact: the Hidden Cost of What You Ship
The average page ships 70-80% of its CSS as unused on initial load (HTTP Archive 2024 data). That unused CSS is not free. It is parsed and indexed. Parsing a few kilobytes is fast. The style recalculation step is not. The engine has to match every selector against every element. A stylesheet full of dead rules makes that matching slower. The fix is a two-step process: an audit and a build-time tool. The audit finds the unused rules. The tool removes them. This is the difference between a page that feels fast and one that feels slow for no visible reason.
The Modern Replacement for BEM
The @scope at-rule is the modern replacement for this problem. It limits selector reach to a DOM subtree. The engine does not have to consider a selector for elements outside that subtree. It is the cleanest way to reduce style recalculation cost without the maintenance burden of BEM-style naming conventions.
@scope (.card) {
  /* Only applies within .card; nothing outside matches. */
  .title { font-size: 1.5rem; }
}
The interaction between unused CSS and INP is indirect but real. When a user interacts with a page, the engine has to run style recalculation and layout to respond. If the page is full of unused rules, the style recalculation step takes longer. The response is delayed. The CLS connection is more direct: any CSS that reserves zero space before content loads is a CLS risk. The fix is the same as for LCP: explicit dimensions or aspect-ratio on every media element.
Forced Synchronous Layout: the INP Killer You Can Fix Today
Interaction to Next Paint measures the time from a user interaction to the next frame that shows a visual response. The most common CSS-related delay is forced synchronous layout. This happens when JavaScript reads a geometric value like offsetWidth or getBoundingClientRect() after a style change. The engine is forced to run layout synchronously so the JavaScript can read the value, even if the layout has not been invalidated yet. The result is jank.
The fix is not to avoid layout entirely. Batch your reads and writes. Read all the geometric values you need, then make all the style changes. The deeper fix is to avoid needing the geometric reads at all. If you are reading layout to make a computation, ask whether the CSS can express that computation directly. The modern answer is often yes.
CSS Containment: the Property That Contains the Damage
CSS containment is the mechanism behind content-visibility. It deserves its own section because it is the most underused performance tool in the language. The contain property tells the engine that a subtree is independent for layout, style, paint, or size purposes. The engine can then skip work on that subtree when it would not affect the rest of the page. This is especially useful for third-party widgets. They often have no idea how their internal changes affect the parent page.
.third-party-widget {
  contain: layout style paint;
  /* Isolates the widget so internal changes
     do not affect the parent page's layout or paint. */
}
The size value is the most aggressive form. It requires the element to have explicit dimensions. It is perfect for fixed-size components like a video player or a modal. Applied to a widget, it means the engine knows the widget cannot affect anything outside it. It can skip layout and paint for the widget subtree entirely when it is off-screen.
Measuring What You Ship: the Performance Panel is Not a Suggestion
No description of rendering cost is accurate without measuring it in the Chrome DevTools Performance panel. Open the page. Start a recording. Perform the interaction or scroll you want to optimize. The panel shows you the layout, paint, and composite events. You can see exactly which one took the longest. This is the only way to know whether a selector is expensive, whether a will-change is helping, or whether the cost you read about in a blog post is real for your page. The engine is the final renderer. It is also the final judge. Do not trust a declaration's reputation. Record its measure.
How to Measure Each Core Web Vital
For LCP, record the load and look at the LCP event in the Performance panel. It shows you what the largest paint was and when it happened. For INP, use the Interactions section to record the exact event that caused the delay. For CLS, you need the Rendering tab and the layout shift region overlay. The panel is the only tool that turns these three metrics into action items.
Frequently Asked Questions
Does CSS selector matching still matter for performance?
No, not for modern pages. Matching a class selector versus an ID selector is noise compared to layout and paint cost. The order of cost is: universal, descendant, child, adjacent sibling, class, ID. But the difference is only in style recalculation, which is rarely the bottleneck. The exception is :has(), which can trigger style recalculation on DOM changes within the matched subtree. The cost is real, but it is still lower than a single layout pass on a complex page.
Is content-visibility: auto stable to use?
It is Baseline Widely Available since 2022. It is the single best performance tool for long pages. The fallback is simple: if the engine does not support it, the content renders as normal. There is no downside to shipping it.
What is the fastest way to improve LCP?
Remove render-blocking CSS from the critical path. Inline the critical CSS. Load the rest asynchronously. Set explicit dimensions on your largest element. That is the whole answer.
Does will-change hurt if overused?
Yes. Each will-change creates a compositor layer. A page with too many layers uses too much memory. Use it only for elements you are about to animate. Remove it after the animation ends.
Can CSS animations run off the main thread?
Only transform and opacity animations are compositor-eligible. Animating any other declaration, including width or top, triggers layout and paint on the main thread. This is the single most important performance boundary in CSS.
Who This Subject Serves
This subject suits the working front-end developer who writes CSS daily and needs to know what a declaration actually costs. It suits the performance-conscious developer who is tired of guessing and wants to measure. It suits the technical writer who needs accurate, sourced statements without laundering guesses into facts.
It does not suit someone learning to code from zero. That reader should start at web.dev/learn/css and return here for the mechanics. It does not suit a designer who wants to learn why a layout works; Every Layout explains that better. It does not suit someone debugging a React state bug; that is a JavaScript site. But if you are the person who has to make the page faster, this is the map. Start with the Performance panel. Apply content-visibility to long lists. Cut unused CSS with an audit. The Performance panel is the only judge. That is the practical detail that makes this page worth reading.
More in Performance
-
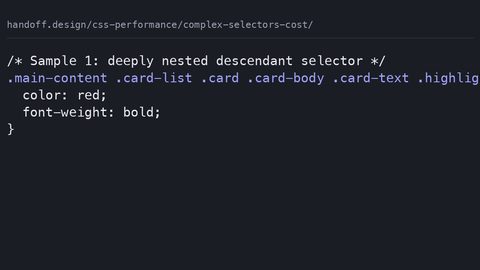 Complex selectors cost
Complex CSS selector matching is rarely the bottleneck in page performance, but specific patterns can increase style recalculation cost. Measure with DevTools, not selector-counting rules.
Complex selectors cost
Complex CSS selector matching is rarely the bottleneck in page performance, but specific patterns can increase style recalculation cost. Measure with DevTools, not selector-counting rules.
-
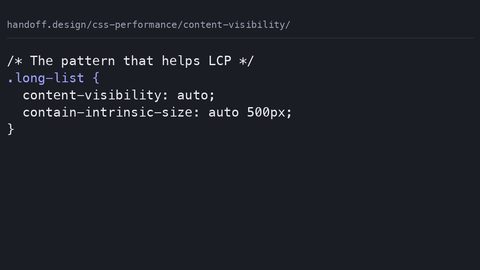 Content visibility
content-visibility defers layout and paint for off-screen content, improving LCP and INP, but requires contain-intrinsic-size to prevent layout shift and breaks find-in-page and accessibility tree exposure.
Content visibility
content-visibility defers layout and paint for off-screen content, improving LCP and INP, but requires contain-intrinsic-size to prevent layout shift and breaks find-in-page and accessibility tree exposure.
-
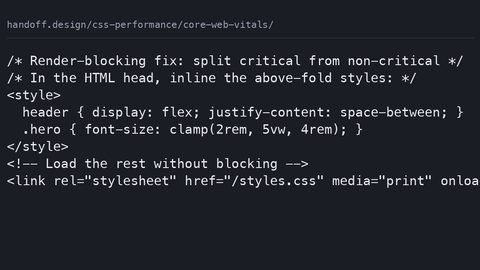 Core web vitals
CSS directly affects all three Core Web Vitals: render-blocking stylesheets delay LCP, un-sized content causes CLS, and main-thread animations block INP; each has a measurable fix.
Core web vitals
CSS directly affects all three Core Web Vitals: render-blocking stylesheets delay LCP, un-sized content causes CLS, and main-thread animations block INP; each has a measurable fix.
-
 Critical CSS guide
Critical CSS inlining eliminates render-blocking requests for above-the-fold content, directly reducing LCP; the improvement is measurable with Lighthouse and proportional to the bytes deferred.
Critical CSS guide
Critical CSS inlining eliminates render-blocking requests for above-the-fold content, directly reducing LCP; the improvement is measurable with Lighthouse and proportional to the bytes deferred.
-
 CSS in JavaScript performance
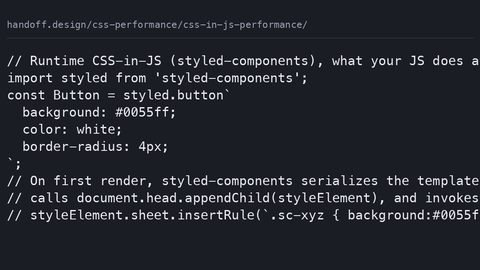
Runtime CSS-in-JS libraries inject styles via JavaScript, adding main-thread bytes and delaying LCP; zero-runtime alternatives extract static CSS at build time, eliminating the JavaScript dependency.
CSS in JavaScript performance
Runtime CSS-in-JS libraries inject styles via JavaScript, adding main-thread bytes and delaying LCP; zero-runtime alternatives extract static CSS at build time, eliminating the JavaScript dependency.
-
 CSS loading best practices
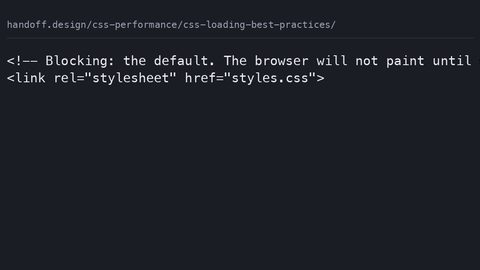
CSS loading strategies range from blocking to fully deferred; the media attribute and preload+onload patterns eliminate render-blocking while preventing FOUC, with LCP improvement measurable in Lighthouse.
CSS loading best practices
CSS loading strategies range from blocking to fully deferred; the media attribute and preload+onload patterns eliminate render-blocking while preventing FOUC, with LCP improvement measurable in Lighthouse.
-
 Lighthouse auditing
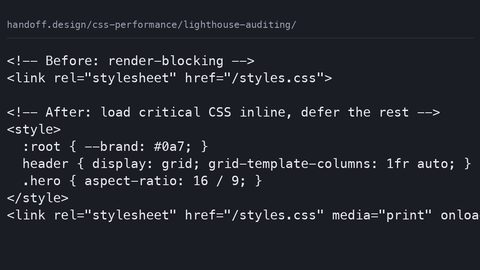
Lighthouse isolates CSS performance problems through specific audits: render-blocking resources, unused CSS bytes, and layout shifts; each maps to a measurable LCP, CLS, or TBT improvement.
Lighthouse auditing
Lighthouse isolates CSS performance problems through specific audits: render-blocking resources, unused CSS bytes, and layout shifts; each maps to a measurable LCP, CLS, or TBT improvement.
-
 Minification compression
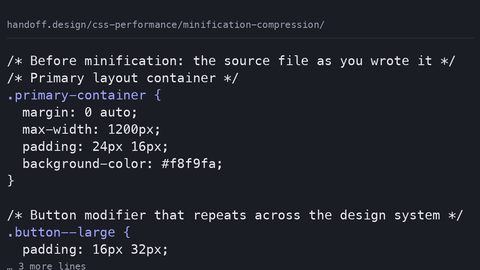
CSS minification removes whitespace and comments from source files; compression with gzip or brotli reduces transfer bytes over the wire; both are measurable in DevTools as reduced download size.
Minification compression
CSS minification removes whitespace and comments from source files; compression with gzip or brotli reduces transfer bytes over the wire; both are measurable in DevTools as reduced download size.
-
 Optimizing custom properties
CSS custom properties enable runtime theming but trigger style recalculation on all descendants when changed; the cost is measurable in DevTools and proportional to the inheritance chain length.
Optimizing custom properties
CSS custom properties enable runtime theming but trigger style recalculation on all descendants when changed; the cost is measurable in DevTools and proportional to the inheritance chain length.
-
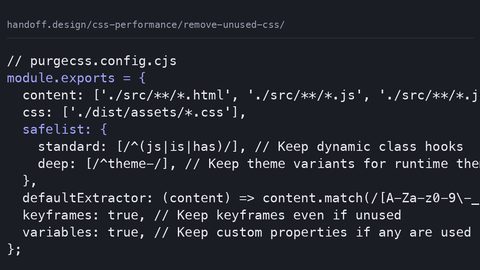 Remove unused CSS
Measure and remove unused CSS with the Coverage panel and PurgeCSS to reduce render-blocking bytes and improve LCP, without breaking conditionally-applied styles.
Remove unused CSS
Measure and remove unused CSS with the Coverage panel and PurgeCSS to reduce render-blocking bytes and improve LCP, without breaking conditionally-applied styles.
Read next
-
CSS loading best practices
CSS loading strategies range from blocking to fully deferred; the media attribute and preload+onload patterns eliminate render-blocking while preventing FOUC, with LCP improvement measurable in Lighthouse.
-
CSS in JavaScript performance
Runtime CSS-in-JS libraries inject styles via JavaScript, adding main-thread bytes and delaying LCP; zero-runtime alternatives extract static CSS at build time, eliminating the JavaScript dependency.
-
Optimizing custom properties
CSS custom properties enable runtime theming but trigger style recalculation on all descendants when changed; the cost is measurable in DevTools and proportional to the inheritance chain length.
-
Core web vitals
CSS directly affects all three Core Web Vitals: render-blocking stylesheets delay LCP, un-sized content causes CLS, and main-thread animations block INP; each has a measurable fix.
-
Complex selectors cost
Complex CSS selector matching is rarely the bottleneck in page performance, but specific patterns can increase style recalculation cost. Measure with DevTools, not selector-counting rules.
-
Minification compression
CSS minification removes whitespace and comments from source files; compression with gzip or brotli reduces transfer bytes over the wire; both are measurable in DevTools as reduced download size.